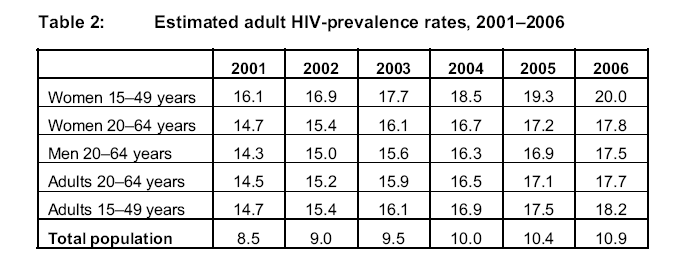
Do you know what the figures in the HIV prevalence table mean? That is, are the figures rates per 100 or 1,000 members of the population?
One thing I found interesting about those figures is that the estimated increase over 2001-2006 has been quite constant, at around 0.5 per annum. Projecting forward, this would mean that HV prevalence would double roughly once every 20 years. That's not as bad as it could be. I'm actually quite surprised that HIV rates aren't increasing at a compounding rate. A 5% compounding annual increase would see reates double in between 14-15 years, rather than 20.
I guess I knew this, but I was in denial. I have only been to SA twice, but it is bizzare to think that every tenth person I passed in the street or in a store might be HIV positive. My wife tells me that things are much worse the further north one moves in Africa.
I live in a very sheltered society (New Zealand), which is largely untouched by the rampages of HIV/AIDS. In the last 10 years (10 YEARS!!!) in NZ there have been a total of 1521 cases of HIV identified (by way of viral load testing). There are roughly 4.1 million people living in NZ.
Hopefully that explains why I didn't automatically read the figures in the SA tables as being percentages. In NZ we are so used to mortality and morbity rates being expressed per 1000 persons.

3 comments:
Hein,
Do you know what the figures in the HIV prevalence table mean? That is, are the figures rates per 100 or 1,000 members of the population?
One thing I found interesting about those figures is that the estimated increase over 2001-2006 has been quite constant, at around 0.5 per annum. Projecting forward, this would mean that HV prevalence would double roughly once every 20 years. That's not as bad as it could be. I'm actually quite surprised that HIV rates aren't increasing at a compounding rate. A 5% compounding annual increase would see reates double in between 14-15 years, rather than 20.
Paul.
My God.
I guess I knew this, but I was in denial. I have only been to SA twice, but it is bizzare to think that every tenth person I passed in the street or in a store might be HIV positive. My wife tells me that things are much worse the further north one moves in Africa.
I live in a very sheltered society (New Zealand), which is largely untouched by the rampages of HIV/AIDS. In the last 10 years (10 YEARS!!!) in NZ there have been a total of 1521 cases of HIV identified (by way of viral load testing). There are roughly 4.1 million people living in NZ.
Hopefully that explains why I didn't automatically read the figures in the SA tables as being percentages. In NZ we are so used to mortality and morbity rates being expressed per 1000 persons.
Paul.
At some point (some estimate 2008), prevalence starts to drop as deaths increase - HIV+ people removed from the numerator and denominator.
Post a Comment